Short Answer

Both the model and the market expect CPI month-over-month in May 2026 to be exactly 0.5%, with no compelling evidence of mispricing.

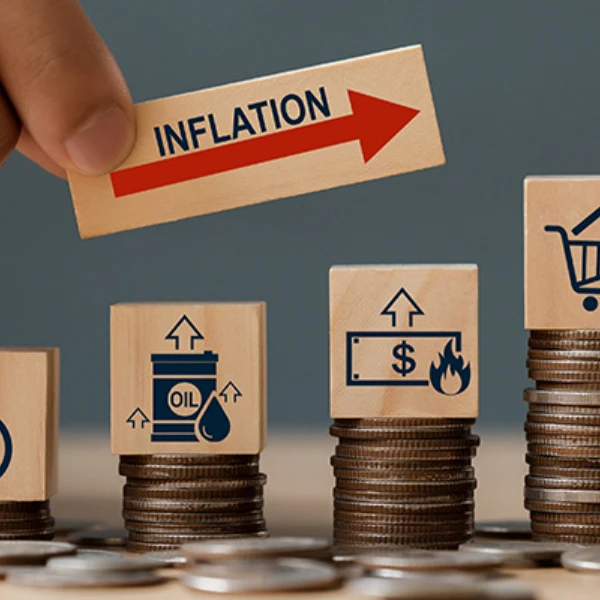
1. Executive Verdict

  • The Cleveland Fed nowcast indicates 0.27% for May 2026 CPI MoM.
  • Sustained high energy prices and tariffs likely drive positive inflation.
  • Shelter costs significantly contributed to headline CPI increases in early 2026.
  • ISM Manufacturing PMI Prices Index is a strong leading May CPI indicator.
  • The BLS May 2026 CPI release is scheduled for Jun 10, 2026.

Who Wins and Why

Outcome Market Model Why
Exactly 0.6% 12.0% 12.0% Strong consumer demand and wage growth are driving elevated price increases.
Exactly 0.0% 1.0% 0.8% Stable supply chains and balanced demand are keeping prices flat.
Exactly 0.2% 6.0% 13.4% Modest economic growth supports slight price increases across sectors.
Exactly 0.1% 7.0% 6.3% Very mild demand and some inventory adjustments lead to minimal price changes.
Exactly 0.4% 18.0% 17.3% Resilient consumer spending and firm labor markets are pushing prices moderately higher.

Current Context

Inflation currently remains elevated, with recent data showing a 3.3% year-over-year increase in the all-items index, a notable jump from 2.4% in February [^] [^] [^] [^] . Shelter costs also contributed to this rise, increasing by 0.3% in March [^][^][^]. Experts have identified the "war in Iran," which commenced in late February, as a significant factor driving up energy prices, particularly with Brent crude oil trading around $100 per barrel [^][^][^]. Tariffs are also noted as contributing to inflationary pressures, and consumers continue to feel the impact of high gasoline prices [^][^][^].
Upcoming reports and forecasts anticipate persistent inflation pressures. The Consumer Price Index for April 2026 is scheduled for release on May 12, 2026, at 8:30 a.m. ET [^][^][^]. The CPI for May 2026, which is the subject of this prediction market, will be released on June 10, 2026, at 8:30 a.m. ET [^][^]. Other pertinent economic releases in May 2026 include the Personal Consumption Expenditures (PCE) price index around May 28, the Job Openings and Labor Turnover Survey for March on May 5, and the Employment Situation for April on May 8 [^][^]. RBC Economics projects a +0.7% month-over-month increase in April's headline inflation, primarily driven by elevated gasoline prices, and anticipates core inflation to accelerate to +0.3% month-over-month, pushing the year-over-year pace to 2.7% [^]. Bell Bank also anticipates April's annualized inflation data to show 3.5%, an increase from the 3.3% reported in March [^].
Experts forecast persistent inflation, remaining above the Fed's target. The Federal Open Market Committee (FOMC) maintains price stability as a primary mandate, acknowledging that inflation remains "significantly above its long-term 2% target" [^]. The FOMC is widely expected to keep rates unchanged at its late April meeting, with expectations for only one rate cut in 2026 [^]. Bell Bank believes the Fed's 2% target is still distant, projecting 3% as a more probable inflation rate for the foreseeable future [^]. Goldman Sachs forecasts core CPI to ease from 2.6% in March to 2.1% by year-end 2026, despite a projected 14% rise in energy spending this year [^][^]. Conversely, RSM has lowered its U.S. GDP forecast for 2026 to 1.7% and expects CPI inflation to peak at 4.5%, suggesting a "stagflation light" scenario [^]. A survey of Chief Financial Officers by the San Francisco Fed indicates price growth expectations of 3.6% for calendar year 2026, implying that core CPI inflation could remain elevated [^]. Long-run inflation expectations have edged down slightly to 3.4% from 3.5% [^]. Prediction markets are currently showing probabilities for the CPI being above 3.5%, 3.6%, 3.7%, and higher, with the market resolving on June 10, 2026, upon the official data release [^][^].

2. Market Behavior & Price Dynamics

Historical Price (Probability)

Outcome probability
Date
This prediction market has exhibited a completely static price trend since its inception. The probability has remained unchanged at 7.0%, with no significant movements, spikes, or drops recorded across the available data points. The market opened at this price and has not deviated, indicating a lack of new information being priced in by traders. The provided context regarding currently elevated year-over-year inflation and rising shelter costs has had no discernible impact on the market's price, as there has been no trading activity to reflect a reaction to this news.
The most critical feature of this market is the trading volume, which stands at zero contracts. This complete absence of trading activity suggests there is no market conviction or active participation. The 7.0% price does not represent a consensus forecast but rather an initial listing price that has not been tested by either buying or selling pressure. Consequently, it is impossible to identify any meaningful support or resistance levels. The chart does not reflect genuine market sentiment but rather a dormant state, indicating that traders have not yet engaged with this market to form a collective opinion on the probability of month-over-month CPI in May 2026.

3. Significant Price Movements

Notable price changes detected in the chart, along with research into what caused each movement.

📉 April 28, 2026: 8.0pp drop

Price decreased from 14.0% to 6.0%

Outcome: Exactly -0.1%

What happened: The provided sources exclusively detail the CPI release schedule, indicating that the CPI data for May 2026 is scheduled for release on June 10, 2026 [^]. These sources do not contain any information regarding social media activity, traditional news, or market structure factors that occurred on or around April 28, 2026. Therefore, based on the available information, it is not possible to identify the primary driver of the described 8.0 percentage point price movement. Social media's role in this specific market movement cannot be determined from the provided data.

4. Market Data

View on Kalshi →

Contract Snapshot

This market resolves to Yes if the May 2026 month-over-month Consumer Price Index (CPI) is exactly 0.3%, as verified by the Bureau of Labor Statistics. If the CPI is not exactly 0.3%, the market resolves to No; this specific outcome is mutually exclusive with other potential exact CPI values. The market opened on December 15, 2025, and will close either when the outcome occurs or by June 10, 2026, at 8:29 am EDT, with projected payout 30 minutes after closing.

Available Contracts

Market options and current pricing

Outcome bucket Yes (price) No (price) Last trade probability
Exactly 0.5% $0.24 $0.86 22%
Exactly 0.3% $0.19 $0.82 18%
Exactly 0.4% $0.22 $0.82 18%
Exactly 0.6% $0.19 $0.87 12%
Exactly -0.2% $0.05 $1.00 7%
Exactly 0.1% $0.01 $1.00 7%
Exactly -0.1% $0.02 $1.00 6%
Exactly 0.2% $0.16 $0.94 6%
Exactly 0.0% $0.03 $1.00 1%
Exactly 0.7% $0.18 $0.92 0%
Exactly 0.8% $0.13 $0.97 0%
Exactly 0.9% $0.09 $0.98 0%
Exactly 1.0% $0.06 $0.99 0%

Market Discussion

Prediction markets on Robinhood suggest a median trader expectation of approximately 0.4% for May 2026 CPI month-over-month, with a 33% probability of it exceeding 0.5% [^]. This follows an actual CPI month-over-month increase to 0.9% in March 2026, up from 0.3% in February <a href="https://www.bls.gov/news.release/cpi.nr0.htm" target="_blank" rel="nofollow noopener noreferrer" class="citation-link" title="Consumer Price Index Summary

  • 2026 M03 Results">[^][^]. While an explicit economist consensus forecast for May 2026 is not available, general inflation concerns persist amid tariffs and energy shocks [^][^].

5. Which leading economic indicators released in May 2026 will provide the strongest signals for the May CPI report?

May CPI Report Release DateJune 10 [^]
April 2026 ISM Manufacturing PMI Prices Index84.6% [^]
ISM Prices Index Lead Time to CPI2-3 months [^][^][^][^]
The ISM Manufacturing PMI Prices Index is a strong May CPI indicator. This index is considered the most significant leading signal for the May Consumer Price Index (CPI) report [^]. According to the April 2026 ISM Manufacturing PMI report, the index reached 84.6%, marking its highest level since 2022 [^]. Historically, this specific index typically precedes the Consumer Price Index by a period of two to three months [^][^][^][^].
Other May economic indicators also point to potential inflationary pressures. Additional economic data released in May 2026 provided further insights into inflationary trends. The New York Fed's Survey of Consumer Expectations (SCE) indicated an increase in 1-year inflation expectations for April, rising to 3.6% [^]. Furthermore, the first-quarter Productivity & Costs report documented a 2.3% rise in unit labor costs, which suggests potential wage-driven inflation [^]. The Producer Price Index (PPI) also serves as a valuable lead indicator for the CPI, usually by one to three months [^]. The official May CPI report is scheduled for release on June 10 [^].

6. How do the 2026 inflation forecasts from RBC Economics, Bell Bank, and RSM differ in their assumptions about energy prices and Federal Reserve policy?

RBC Fed ForecastHold through 2026, 50bps cuts in H2 [^][^]
Bell Bank InflationAround 3% due to oil spikes [^]
RSM CPI Forecast4.5% due to energy shock [^]
Forecasts diverge on energy prices and their inflationary impact. RBC Economics anticipates elevated but moderating energy prices, expecting little core inflation passthrough and no systemic inflation from higher oil prices [^]. Bell Bank, however, projects that oil spikes will keep inflation around 3% [^], while RSM foresees an energy shock driving the Consumer Price Index (CPI) to 4.5% [^]. All three institutions concur that a Middle East conflict involving Iran and the Strait of Hormuz could significantly spike oil and gas prices, leading to a substantial month-over-month increase in headline CPI [^][^][^].
Federal Reserve policy predictions vary from cuts to delayed action. RBC Economics forecasts that the Fed will maintain its current policy through 2026, followed by 50 basis point cuts in the second half of that year [^][^]. Bell Bank's perspective notes that market expectations lean towards higher rates for a longer period, categorizing the Fed as neutral at its present levels [^]. In contrast, RSM expects the Federal Reserve to postpone rate cuts, attributing this delay to a backdrop of stagflation [^][^].

7. How does the contribution of shelter costs to headline CPI in H1 2026 compare with the Fed's preferred PCE inflation measure?

Shelter Index Monthly Increase (Feb 2026)0.2% [^]
Shelter Index Annual Increase (Feb 2026)3.0% [^]
Shelter Weight in CPI vs PCECPI ~36%, PCE ~15-17% [^]
Shelter costs significantly contributed to headline CPI increases in early 2026. During the first half of 2026, shelter expenses were a major factor driving the Consumer Price Index (CPI) momentum. The Bureau of Labor Statistics (BLS) reported in February 2026 that shelter was identified as the largest contributor to the overall monthly CPI increase. In that month, the shelter index rose by 0.2% month-over-month and increased by 3.0% over the preceding year [^].
Shelter's impact on PCE inflation is mechanically lower than CPI. Despite its strong influence on CPI, shelter carries a considerably lower weighting in the Personal Consumption Expenditures (PCE) inflation measure, which is the Federal Reserve's preferred metric. Shelter's weight in PCE is approximately 15–17%, whereas in CPI, it is around 36% [^]. Another assessment indicates a shelter weight of about 34% in CPI compared to approximately 16% in PCE [^]. Consequently, even identical shelter inflation trends will have a smaller overall effect on PCE inflation relative to headline CPI, highlighting shelter costs' more significant mechanical role in headline CPI than in the Fed-preferred PCE [^].

8. Which high-frequency data sources, like the Cleveland Fed's Nowcast, provide the most reliable real-time estimates for CPI ahead of the official BLS release?

Nowcast ReliabilityReliable for real-time CPI estimates ahead of BLS release [^][^][^]
Update FrequencyDaily (every business day) [^][^]
Market RelevanceMost directly relevant high-frequency source for current month CPI [^][^][^]
The Cleveland Fed's Nowcast offers reliable real-time CPI estimates. Its headline CPI nowcast provides dependable real-time estimates for CPI in advance of the official BLS release [^][^][^]. This tool is specifically designed to estimate current-month CPI inflation, positioning it as the most directly relevant high-frequency source for month-over-month prediction markets, such as for a May 2026 CPI [^][^][^]. These inflation nowcasts are updated daily on business days and are made publicly available on its website, explicitly described as estimates or forecasts of the present before the BLS CPI release [^][^].
Its mixed-frequency model uses high-frequency inputs like energy prices. The Cleveland Fed's approach employs a mixed-frequency model that incorporates high-frequency inputs such as daily oil prices and weekly gasoline prices [^][^][^]. This methodology, by leveraging key high-frequency series, including energy components, is regarded as highly informative concerning near-term CPI inflation dynamics [^][^]. While tools like Truflation exist, they are more appropriately viewed as faster-moving leading indicators or complementary sources, with the Cleveland Fed's nowcast standing out as the most directly relevant high-frequency source for canonical CPI month-over-month nowcasts [^].

9. What is the expected impact of Brent crude oil prices and U.S. tariff policies on the goods component of the May 2026 CPI?

Brent Crude Price$116/bbl on May 1, 2026 [^][^]
Gasoline Contribution to March 2026 CPI0.6 percentage points [^][^]
Probability of May 2026 CPI MoM > 0.3%67% [^]
Brent crude oil prices significantly influence the goods component of CPI. High crude oil prices are directly linked to substantial increases in gasoline prices. For instance, on May 1, 2026, Brent crude was priced at $116/bbl, which contributed to national average gasoline prices reaching $4.00/gal or more [^][^]. The first quarter of 2026 experienced sharp increases in crude oil and petroleum product prices [^]. A $10/bbl rise in WTI crude typically adds $0.20-0.30/gal to gasoline prices, potentially pushing gasoline into the $4-5/gal range [^]. In March 2026, gasoline prices rose by 21.2% month-over-month, contributing approximately 0.6 percentage points to the headline CPI [^][^].
U.S. tariff policies are also expected to accelerate core CPI. Tariffs enacted in 2025 have already demonstrated an impact, raising core goods PCE by 3.1% by February 2026 due to full cost pass-through [^]. These tariffs are specifically anticipated to accelerate core CPI month-over-month starting from May 2026 [^]. The prediction market further indicates a high probability for an increased CPI, with a 67% chance that the CPI month-over-month in May 2026 will exceed 0.3%, and a 65% probability it will be greater than 0.4% [^].

10. What Could Change the Odds

Key Catalysts

The BLS May 2026 CPI release is scheduled for Jun 10, 2026 at 8:30 ET [^] [^] . The Cleveland Fed's May 2026 CPI MoM nowcast indicates 0.27% for headline and 0.21% for core inflation, based on an update from May 5-7 [^][^]. A 'hot' CPI reading is considered bearish for rate cuts (bullish USD), while a 'miss' would be bullish for rate cuts [^][^].
Inflation appears to be reaccelerating, with March YoY at 3.3% [^] [^] , following a March 2026 CPI MoM actual of 0.9% (prior Feb 0.3%) [^] [^] . This reacceleration could lead to a potential Fed hawkish shift [^][^]. The April 2026 CPI MoM was released May 12, with a forecast of ~0.6% [^][^]. Additionally, Trump has critiqued Powell amid rising yields [^][^].

Key Dates & Catalysts

  • Expiration: September 09, 2026
  • Closes: June 10, 2026

11. Decision-Flipping Events

  • Trigger: The BLS May 2026 CPI release is scheduled for Jun 10, 2026 at 8:30 ET [^] [^] .
  • Trigger: The Cleveland Fed's May 2026 CPI MoM nowcast indicates 0.27% for headline and 0.21% for core inflation, based on an update from May 5-7 [^] [^] .
  • Trigger: A 'hot' CPI reading is considered bearish for rate cuts (bullish USD), while a 'miss' would be bullish for rate cuts [^] [^] .
  • Trigger: Inflation appears to be reaccelerating, with March YoY at 3.3% [^] [^] , following a March 2026 CPI MoM actual of 0.9% (prior Feb 0.3%) [^] [^] .

13. Historical Resolutions

Historical Resolutions: 20 markets in this series

Outcomes: 1 resolved YES, 19 resolved NO

Recent resolutions:

  • KXECONSTATCPI-26MAR-T1.5: NO (Apr 10, 2026)
  • KXECONSTATCPI-26MAR-T1.4: NO (Apr 10, 2026)
  • KXECONSTATCPI-26MAR-T1.3: NO (Apr 10, 2026)
  • KXECONSTATCPI-26MAR-T1.2: NO (Apr 10, 2026)
  • KXECONSTATCPI-26MAR-T1.1: NO (Apr 10, 2026)